A q-band pulse epr/endor spectrometer and the implementationof advanced one- and two-dimensional pulse epr methodology
Journal of Magnetic Resonance 149, 196–203 (2001) doi:10.1006/jmre.2001.2298, available online at http://www.idealibrary.com on
A Q-Band Pulse EPR/ENDOR Spectrometer and the Implementation
of Advanced One- and Two-Dimensional Pulse EPR Methodology
I. Gromov,∗,1 J. Shane,∗ J. Forrer,∗ R. Rakhmatoullin,† Yu. Rozentzwaig,† and A. Schweiger∗
∗Laboratory of Physical Chemistry, ETH-Zentrum, Swiss Federal Institute of Technology, CH-8092 Z¨urich, Switzerland; and †Laboratory of MagneticRadiospectroscopy and Quantum Electronics, Kazan State University, 420008 Tatarstan, Russian Federation
Received September 18, 2000; revised January 23, 2001; published online March 20, 2001
A versatile high-power pulse Q-band EPR spectrometer operat-
at microwave (mw) frequencies of about 95 GHz (W-band) and
ing at 34.5–35.5 GHz and in a temperature range of 4–300 K is
higher (6–10) as well as below 9 GHz (11, 12) have become of
described. The spectrometer allows one to perform one- and two-
much interest. However, only a few pulse EPR spectrometers are
dimensional multifrequency pulse EPR and pulse ENDOR experi-
capable of measuring electron spin echoes (and ESEEM) or free
ments, as well as continuous wave experiments. It is equipped with
induction decays (FID) in the frequency range between X-band
two microwave sources and four microwave channels to generate
and W-band (13–17). This is in contrast to continuous wave (cw)
pulse sequences with different amplitudes, phases, and carrier fre-
EPR spectroscopy, where Q-band (35 GHz) frequencies are used
quencies. A microwave pulse power of up to 100 W is available. Two channels form radiofrequency pulses with adjustable phases for ENDOR experiments. The spectrometer performance is demon-
ENDOR and ESEEM experiments at Q-band frequencies have
strated by single crystal pulse ENDOR experiments on a copper
a number of advantages compared to the corresponding exper-
complex. A HYSCORE experiment demonstrates that the advan-
iments at X-band and W-band. At 35 GHz the static magnetic
tages of high-field EPR and correlation spectroscopy can be com-
field B0 is often sufficiently high to separate EPR spectra of
bined and exploited at Q-band. Furthermore, we illustrate how this
different paramagnetic species, resolve features belonging to
combination can be used in cases where the HYSCORE experiment
different g principal values in disordered systems, and separate
is no longer effective at 35 GHz because of the shallow modulation
ENDOR (or ESEEM) lines of different nuclei. With increasing
depth. Even in cases where the echo modulation is virtually ab-
mw frequency, and correspondingly increasing magnetic field,
sent in the HYSCORE experiment at Q-band, matched microwave
the quality of an ENDOR spectrum is subject to two compet-
pulses allow one to get HYSCORE spectra with a signal-to-noise
ing processes, namely the increase in spin polarization and the
ratio as good as at X-band. Finally, it is shown that the high mi- crowave power, the short pulses, and the broad resonator band-
reduction of the hyperfine enhancement of the radiofrequency
width make the spectrometer well suited to Fourier transform EPR
(RF) field (18). At Q-band frequencies spin polarization and the
experiments.
enhancement factor represent a good compromise for resolution
C 2001 Academic Press Key Words: ESEEM; HYSCORE; matching; FT EPR.
Concerning the application of ESEEM spectroscopy, several
situations must be distinguished. In the case of weak hyper-
INTRODUCTION
fine couplings the ESEEM amplitude will decrease with in-creasing magnetic fields (2), so that ESEEM at Q-band is su-
Pulse electron paramagnetic resonance (EPR) has become an
perior to W-band. In the case of strong hyperfine couplings,
important spectroscopic tool in physics, chemistry, biology, and
the modulation amplitude is often larger at higher mw frequen-
materials science to evaluate small hyperfine interactions and
cies due to a stronger state mixing. If the so-called cancella-
nuclear quadrupole couplings in solids, to study short-lived para-
tion condition is fulfilled, the modulation amplitude is max-
magnetic species, and to investigate the dynamics of paramag-
imum at a particular magnetic field and mw frequency (19).
netic compounds (1–5). In particular, one- and two-dimensional
For such situations, Q-band frequencies represent their own
electron spin echo envelope modulation (ESEEM) techniques
niche to combine hyperfine couplings and nuclear Zeeman
and pulse electron nuclear double resonance (ENDOR) meth-
ods have become very popular in the past couple of years.
The large bandwidth, the high quality factor, and the moderate
The great majority of the pulse EPR spectrometers work at
filling factor make standard Q-band mw cavities convenient for
X-band frequencies (9 GHz). Recently, pulse EPR spectroscopy
pulse applications. In this frequency range mw components arestill comparable in quality with X-band components, and the
1 On leave from MRS Laboratory, Kazan State University, Kazan, 420008,
technical specifications make the construction of a pulse Q-band
1090-7807/01 $35.00Copyright C 2001 by Academic PressAll rights of reproduction in any form reserved.
It has been demonstrated that pulse ENDOR and ESEEM ex-
periments at Q-band frequencies can be carried out by using aslightly modified low-power superheterodyne EPR spectrometer(13). With this setup a number of standard pulse EPR experi-ments have been carried out on some particular samples. Betterperformance was obtained with an incoherent instrument usinga pulsed IMPATT generator as the mw source (14, 20). Re-cently, a coherent high-power spectrometer has been describedwhich uses homodyne detection and a TWT amplifier for themw pulses (15). These authors also discussed sensitivity as-pects of ESEEM and pulse ENDOR experiments at Q-bandand presented a number of applications using standard pulseschemes.
So far, advanced pulse EPR methods have not been imple-
mented at Q-band frequencies. One of these techniques is hy-perfine sublevel correlation (HYSCORE) spectroscopy (21),which has become a standard tool for measuring small hyper-
Simplified block diagram of the Q-band mw bridge. The main
fine couplings of paramagnetic species. Besides HYSCORE,
components are as follows: (1) E-110 Varian bridge; (2) mechanical waveguide
a number of more sophisticated correlation experiments have
switch; (3) probe head; (4) electronically controlled commutator; (5) Gunn os-
been invented, for example, double nuclear coherence transfer
cillator; (6) pulse forming unit; (7) fast mw switch; (8) solid state preamplifier;
(DONUT-HYSCORE) (22) and hyperfine correlated ENDOR
(9) travelling wave tube amplifier, TWT; (10) five-port circulator; (11) protect-ing switch; (12) limiter; (13) low noise mw preamplifier; (14, 15) orthomodal
(HYEND) experiments (23). For weak hyperfine couplings the
mixers. Microwave isolators and dc blocks (not shown) are used at critical points.
potential of HYSCORE at Q-band is somewhat reduced becauseof the lower modulation depth compared with X-band. In sucha situation, an improved coherence-transfer scheme based on
A Varian E-110 cw bridge (1) with a klystron (Varian, V1201)
matched mw pulses implemented early at X-band frequencies
supplied by a console (Varian, E-Line E109) serves as the main
can be utilized (24–26).
mw source in the 34.5- to 35.5-GHz range. In the cw mode the
In this work we describe a versatile high-power Q-band pulse
bridge is connected to the probe head (3) via a motor-controlled
EPR/ENDOR spectrometer. It is based on the design of pulse
waveguide switch (2) (Sector Microwave, VCFP). This mode al-
X- and S-band EPR spectrometers (11, 27) and recent devel-
lows one to measure cw EPR spectra as well as to adjust the fre-
opments in mw devices, acquisition electronics, and spectrom-
quency and coupling of the mw cavities. In the pulse mode, the
eter software. The pulse spectrometer, which consists of four
mw power (50 mW) is directed from the bridge to the reference
mw channels, two mw sources, and a pulse ENDOR accessory
arm and the pulse-forming arm. Two diode switches form the mw
with two RF channels, has excellent performance for one- and
source selector (4) and allow one to change the carrier frequen-
two-dimensional routine measurements, as well as for the devel-
cies during an mw pulse sequence. A second frequency source
opment of new pulse methodology. The experimental examples
consists of a Gunn oscillator (5) (Spacek, GKa-50, 50 mW)
given in this work not only demonstrate the performance of the
with mechanical (±1 GHz) and voltage-controlled (±75 MHz)
spectrometer but also illustrate that most of the modern pulse
EPR methodology developed for X-band spectrometers can eas-
The pulse-forming block (6) has four channels; each of them
is equipped with an absorption-type attenuator (0–30 dB), aphase shifter, and a fast mw switch with high-speed driver. High-
SPECTROMETER DESCRIPTION
quality movable waveguide shorts are used in the phase shiftersto vary the mw phase in a stable way between 0 and 360◦. An
The spectrometer is designed as a multipurpose instrument
additional switch (7) is used to equalize the time parameters
for cw and pulse EPR and for pulse ENDOR experiments. A
of the mw pulses in the different channels and further suppress
simplified block diagram of the mw part of the spectrometer is
the leaking mw power. All of the above-mentioned switches are
shown in Fig. 1. Isolators, direct current blocks, and frequency
distinguished by a short switching time (5 ns) and an isolation
monitoring circuits are not shown. Series production and cus-
in the off state of 35 dB. The solid state amplifier (8) (MITEQ,
tom ordered mw components are implemented. The later ones
AMF-5D, 26 dB) works as a preamplifier to drive the pulsed
are optimized according to the requirements of the pulse EPR
100-W traveling wave tube (TWT) amplifier (9) (ASE, 187 Ka).
experiments in the frequency range from 34.5 to 35.5 GHz. Com-
The amplitude of the strongest mw pulse in a pulse sequence
mercial components will be characterized by company names,
is typically tuned to a value such that the TWT operates just
models, and specifications; custom-ordered components will be
below the compression point. This allows for very stable high-
power mw pulses with rise/fall times of 3 ns. To perform FT
EPR experiments where ultrashort mw pulses are required, the
The spectrometer acquisition system is similar to the one re-
switch (7) is replaced by a fast switch with a rise and fall time
ported earlier (28). It consists of a digital word generator (In-
terface Technology, RS690, 250 MHz), a gated integrator (SRS,
After passing the rotary attenuator (HP, R382A, 0–50 dB), the
SR250), a data acquisition board (Keithley, DAS1202), a GPIB
high-power pulses are fed to the input of the five-port circulator
interface, and a user-friendly acquisition program which runs on
(10). A part of the mw power is directed to a diode detector to
a personal computer. The instrument library of the program is
examine the pulses. The isolation of the circulator is improved
extended by the arbitrary waveform generator (LeCroy, LW420),
by introducing a small dielectric disc into port 2 which acts as
and the experiment library is expanded for experiments such as
a tuning inhomogeneity. By an appropriate positioning of the
matched ESEEM, HYSCORE (26), PEANUT (29), and a num-
disc, more than 42-dB attenuation of the wave propagating from
ber of other state-of-the-art sequences. The transient signals are
port 1 to port 3 has been obtained within a 2-GHz range. This is
recorded with a digital oscilloscope (LeCroy, LC534, 1-GHz
at least 12 dB better than that obtained with a broadband factory
All routine Q-band pulse EPR and ENDOR measurements
PERFORMANCE AND EXAMPLES
are carried out with a commercial ENDOR probe head (Bruker,ER5106-QTE, 1.6 mm outer and 1 mm inner diameter sample
tube, TE012 or TE013 mode, 35.2–35.5 GHz). With the slightly
First, we present a pulse ENDOR experiment on a copper-
overcoupled cavity the two-pulse echo of γ -irradiated quartz is
doped α-glycine single crystal. The hyperfine principal values
found to be maximum for mw π/2 and π pulses with lengths of
32.86, 20.66, and 17.4 MHz have been reported for the two di-
8 and 16 ns and an incident mw power of 100 W. The cavity ring-
rectly coordinated and magnetically equivalent nitrogen ligands
down time is less than 100 ns under these conditions. Homebuilt
(30). The Davies ENDOR experiment performed at arbitrary
rectangular and cylindrical cavities for large sample tubes have
crystal orientation shows two well-resolved doublets centered
been constructed and passed test measurements.
at 9.23 and 16.46 MHz with corresponding splittings of 0.6 and
Signal detection is performed by a direct-gain receiver
0.2 MHz (Fig. 2). The spectrum was obtained with an RF pulse
equipped with a quadrature detector. The low-noise amplifier
of length 30 µs and an RF power of 200 W.
(13) (noise figure is 4.3 dB) is protected against high-powerpulses by the switch (11) (75 ns recovery time) and the lim-
Hyperfine Enhancement and Nuclear Nutation
iter (12) (40 ns recovery time). The quadrature detector isbased on orthomodal balanced mixers (14,15) (5.9-dB conver-
The next example should give a feeling for the hyperfine en-
sion losses). Rectangular waveguides (WR28) and coaxial ca-
hancement of ENDOR experiments at Q-band by measuring the
bles (Huber + Suhner, Sucoflex 102) are used to connect the
enhancement factor of the 14N transition observed in Fig. 2.
mw components. The quality of the connections was optimizedusing a vector network analyzer (Hewlett Packard, HP8722D).
In the pulse ENDOR mode, the RF is generated by an ar-
bitrary waveform generator (LeCroy, LW420, 0–100 MHz). Ahomebuilt modulator is used to form the RF pulses. Two RFpulses which differ in frequency and phase can be produced. Adistributed RF amplifier (Kalmus, 137C, 0.01–220 MHz) ampli-fies the RF pulses up to a level of 1 kW. With the Bruker probehead, RF pulses with a power of 200 W generate an RF field of
B2 = 0.9 mT (rotating frame) at the proton resonance frequency
of about 55 MHz when the RF coil is terminated via a 50-
tor. A calibrated current-to-voltage transformer is used to controlthe RF pulses. Rabi oscillations of weakly coupled protons wereused to get reference values for B2. The conversion factor of the
The magnet (Bruker ER-073, 1.7 T, 56-mm air gap), the field
controller (Bruker ER-032M), and the NMR gaussmeter (BrukerER-035) allowed for an accurate setting and a precise controlof the magnetic field. The mw frequency is measured with a
Davies ENDOR spectrum of directly coordinated 14N nuclei of
frequency counter (XL Microwave, Model 3400). A continuous
2 in an α-glycine single crystal, recorded at νmw = 35.32 GHz,
B0 = 1.2068 T, and a temperature of 25 K, with the pulse sequence π–tRF–
flow cryogenic system (Oxford Instruments (UK) Ltd., CF935)
π/2–τ–π–τ–echo, with mw π/2 pulse of length tπ/2 = 40 ns, a delay time τ =
is used for all of the low-temperature measurements.
200 ns, and an RF pulse of length tRF = 30 µs.
for an RF power of 100 W the effective nitrogen nutation fre-quency is νnut = 7.7 kHz (Fig. 3b). Using the conversion factor
proton resonance frequency (54.4 MHz) are the same, a B2 fieldof 0.6 mT is found at 16.56 MHz, resulting in an enhancementfactor + = νnuth ≈ 4.1, where g
the nitrogen nucleus. This enhancement factor is close to the
= 1 + Ah ≈ 4.3, where A = (ν2α−ν2β)h
is the hyperfine coupling and να, νβ are the observed ENDORfrequencies. For the low-frequency line of the ENDOR spectrumthe factor is found to be − = 2.4, which is close to the value
= |1 − Ah | ≈ 2.3. The result indicates
that for strongly coupled nuclei with a low magnetic momentlike 14N the ENDOR enhancement factor at Q-band is consid-erable, which still allows us to perform ENDOR experimentswith relatively short RF pulses. For comparison, at 95 GHz the
+ factor for the case at hand is about 2, and at 9.5 GHz it is
The third example demonstrates that two-dimensional (2D)
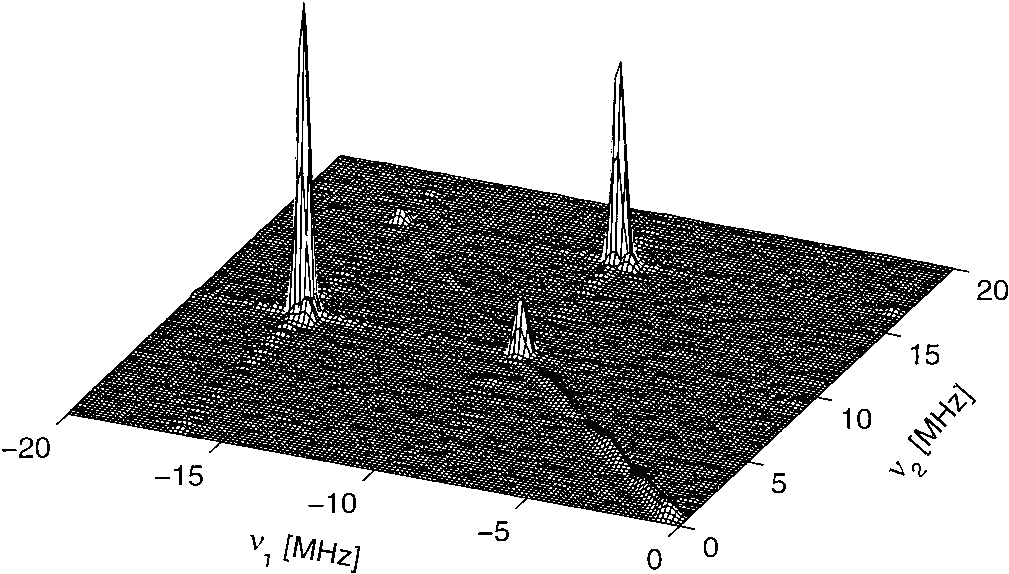
experiments can easily be implemented on the spectrom-eter. The HYSCORE experiment with the pulse sequence
Transient nutations of nitrogen nuclei resonating at 16.56 MHz
π/2–τ–π/2–t1–π–t2–π/2–τ–echo, was again performed on the
(high-frequency line in Fig. 2). (a) Pulse sequence with two RF pulses of opposite
copper-doped α-glycine single crystal with pulse length tπ/2 =
phase. (b) Oscillations of the electron spin echo as a function of time t .
20 ns, tπ = 16 ns, and a time delay τ = 140 ns. A total of 160data points were taken in both time domains t
This is achieved by comparing the nutation frequency of the
values of 40 ns. The dwell time was 24 ns, corresponding to a
nuclei coupled to the unpaired electron with the corresponding
Nyquist frequency of 20.83 MHz. A four-step phase cycle was
frequencies in the absence of hyperfine coupling.
used (33). After baseline correction, apodization with a Gaussian
A new pulse sequence is introduced for the measurement of
window, and zero filling to 256 data points, the HYSCORE spec-
nutation frequencies of nuclei, which is based on a nuclear ro-
trum shown in Fig. 4 with an excellent signal-to-noise ratio was
tary echo experiment (31) and which uses an electron spin echo
obtained. Two strong correlation peaks at (−16.44, 9.28) MHz
to record the nuclear transient nutation (Fig. 3a). The first se-lective mw π pulse creates two-spin order (32). The nuclearpolarization evolves then under a composite RF pulse of con-stant length T , with a first pulse segment of variable length twith the B2 field along the rotating frame +y axis, followedby a second pulse segment of variable length (T − t) with B2along the −y axis. For t = T /2 a nuclear rotary echo is cre-ated. The nuclear transient polarization is indirectly measuredvia a two-pulse echo sequence by recording the polarization ofthe EPR transition, which has a level in common with the nu-clear transition. For the measurement of nutation frequenciesof nuclei with low gyromagnetic ratios, this approach is moreconvenient than monitoring the Rabi oscillations in a Mims orDavies ENDOR experiment. This is because in the rotary echoexperiment the nuclear polarization oscillates at twice the nuta-tion frequency and the B
Nitrogen HYSCORE spectrum of Cu(II) (glycine)2 in an α-glycine
single crystal (same orientation as in Fig. 2) recorded with the sequence π/2–
as in a PEANUT experiment (29). τ–π/2–t1–π–t2–π/2–τ–echo, with mw pulses of length tπ/2 = 20 ns and tπ =
The rotary echo experiment at the high-frequency line (νRF =
16 ns, a delay time τ = 140 ns, initial values t1 and t2 of 40 ns, and a dwell time
16.56 MHz) of the 14N ENDOR spectrum in Fig. 2 shows that
and (−9.28, 16.44) MHz are observed in the (−, +) quadrant,which are at least one order of magnitude more intense then theresidual peaks on the main diagonal. The splittings observed inthe ENDOR spectrum (Fig. 2) are not resolved in the HYSCOREexperiment since we used a relatively poor resolution in the lat-ter experiment because of measuring time limitation (3 h per160 by 160 points).
The next example demonstrates the power of mw pulse match-
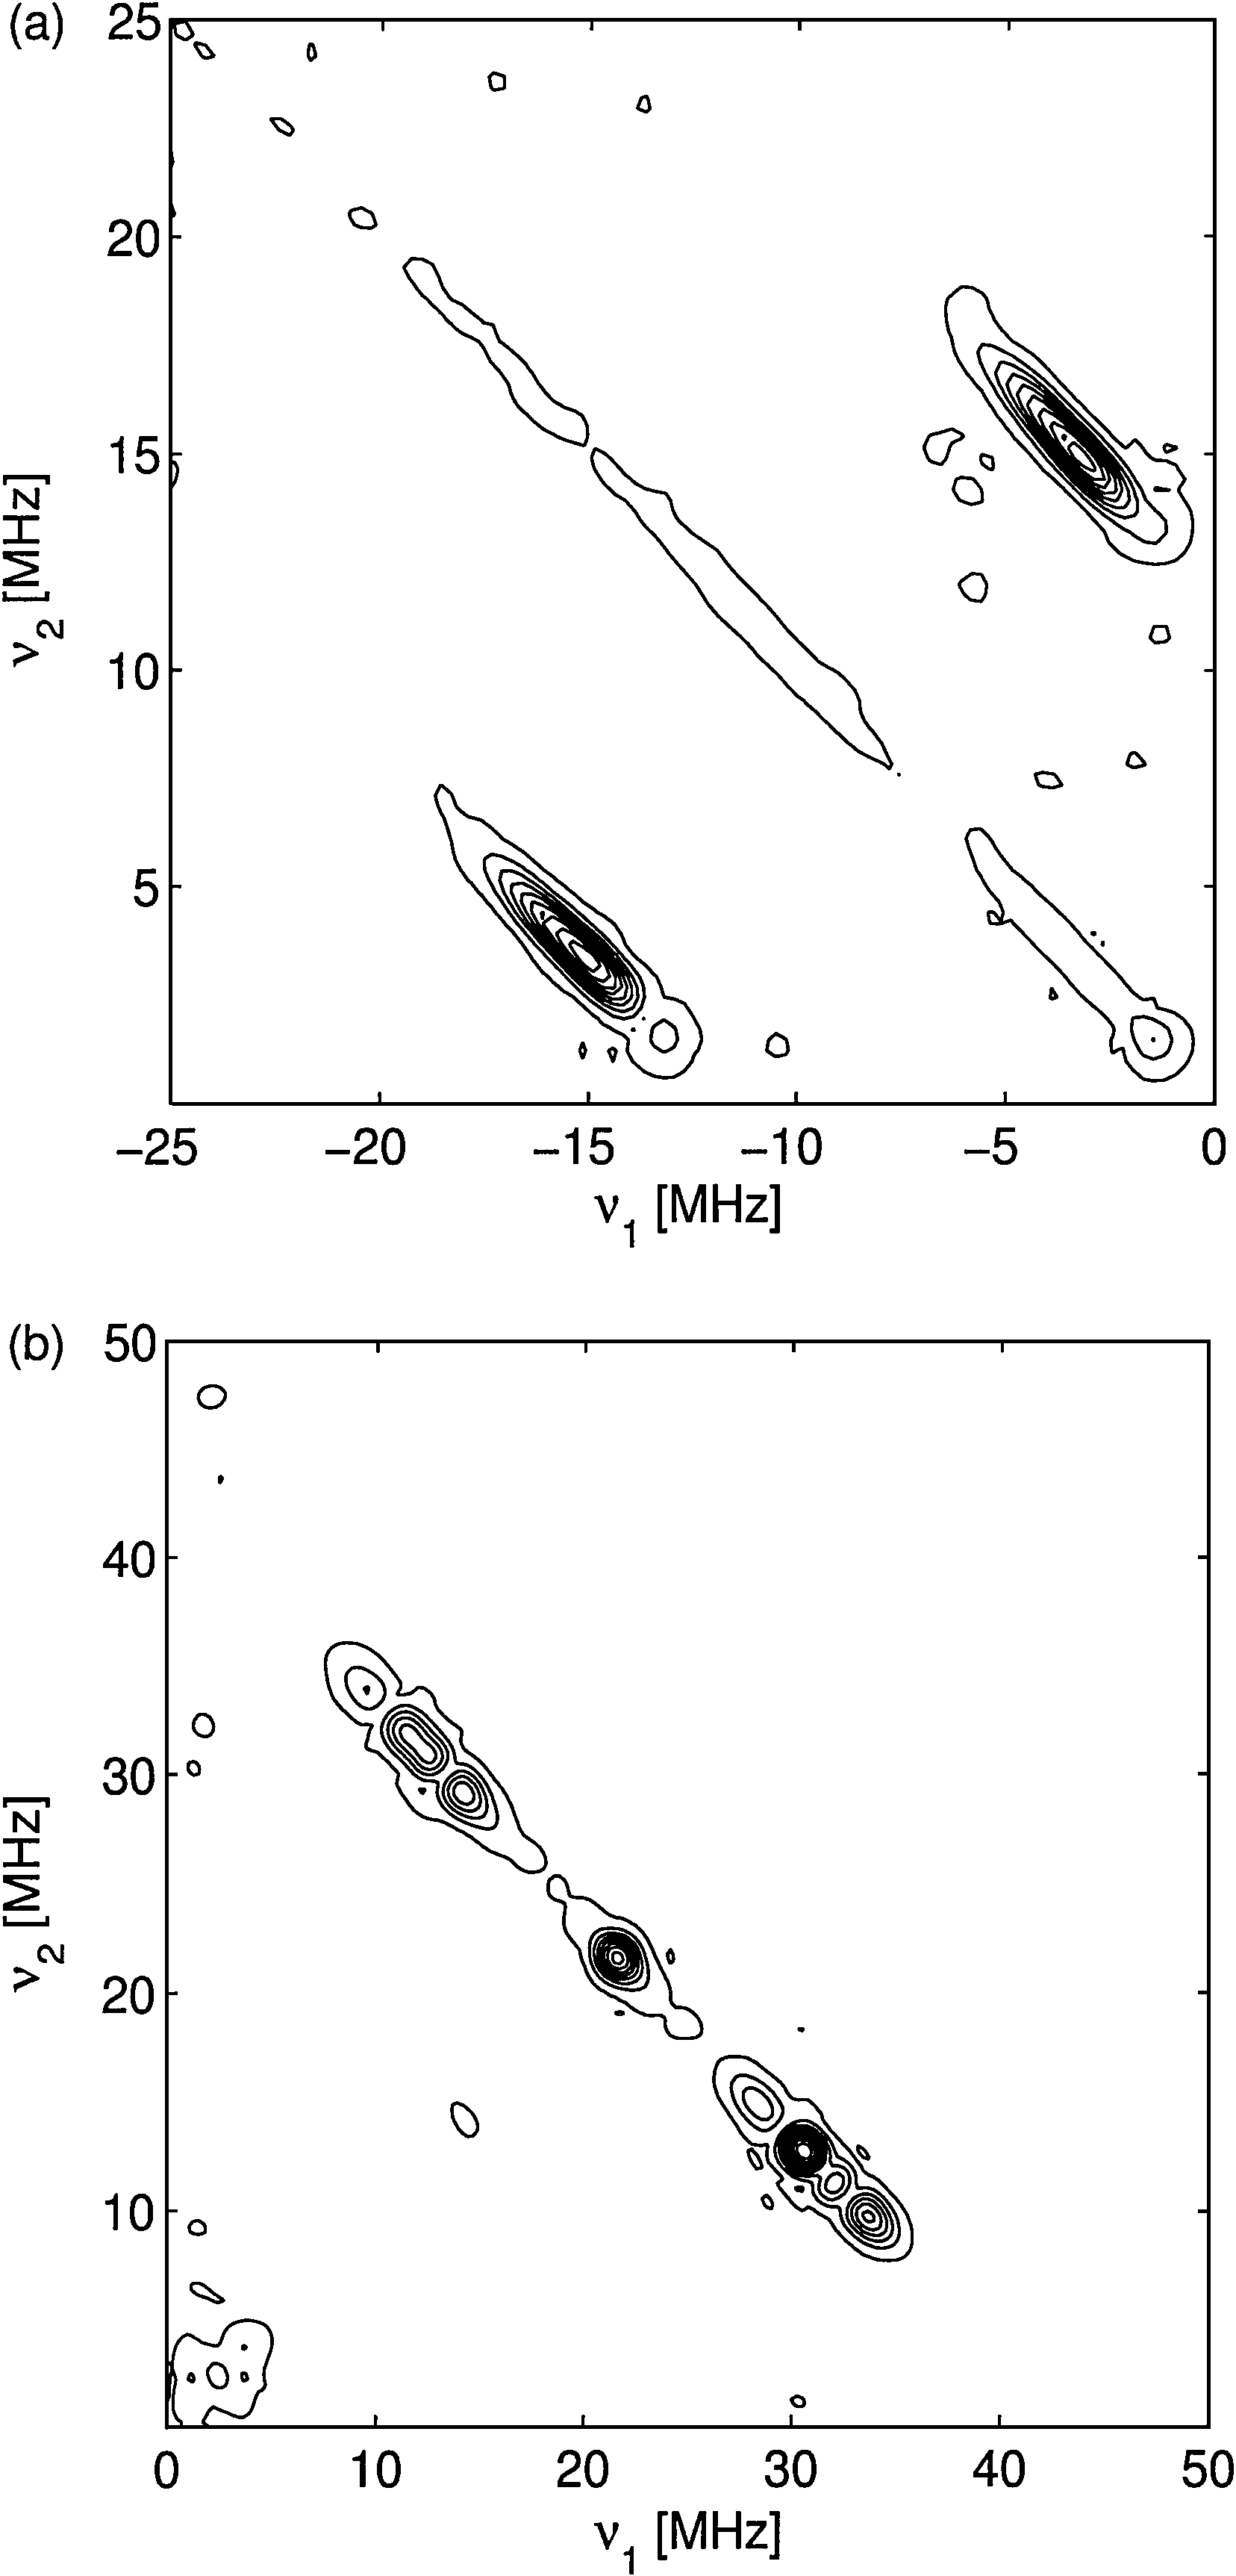
ing at Q-band frequencies for enhancing the modulation depth. At X-band frequencies the three-pulse powder ESEEM experi-ment on vanadyl pyrophosphate hexadecahydrate, VO(P2O7)2,diluted into the corresponding zinc compound shows proton and31P modulations (34), which disappear almost completely at Q-band frequencies. The decay of the stimulated echo measuredwith pulse length 12 ns (ν1 ≈ 21 MHz) at a field position whereall orientations contribute to the signal at Q-band is shown inFig. 5a. From X-band and Q-band cw and pulse measurements, apredominantly isotropic 31P hyperfine coupling of about 19 MHzis found. The Q-band HYSCORE spectrum of VO(P2O7)2 showscorrelation peaks which are slightly above the noise level (datanot shown), whereas at X-band frequencies (ELEXSYS E580spectrometer from Bruker) a signal-to-noise ratio of about 50is found for the same number of accumulations (Fig. 6a). Theobserved correlations represented by ridges parallel to the maindiagonal of the (−, +) quadrant have maxima at (−15.14, 3.42)MHz and (3.42, −15.14) MHz, resulting in an effective hyper-fine coupling of 18.2 MHz.
Using matched three-pulse ESEEM (26), where the field
strength (in frequency units) of the second and third mw pulsescorresponds to the Zeeman frequency of the 31P nuclei, ν1 = νI =
X-band HYSCORE and matched Q-band HYSCORE spectra of
vanadyl pyrophosphate doped into a powder of zinc pyrophosphate hexadecahy-drate. (a) X-band spectrum recorded at B0 = 346.4 mT and νmw = 9.7130 GHz,with pulse lengths tπ/2 = 16 ns and tπ = 20 ns, and τ = 132 ns. A total of 256data points are taken in both directions. (b) Q-band matched HYSCORE spec-trum (B0 = 1.254 T, νmw = 35.29 GHz) obtained with the sequence π/2–τ –match–t1–π–t2–match–τ –echo, with tπ/2 = 12 ns, τ = 148 ns, tmatch = 60 ns,tπ = 24 ns. A total of 128 × 128 data points are measured. The mw field ismatched to the phosphorus Zeeman frequency of 21 MHz. A dwell time of 8 nsis used in both cases. Ten equidistant contours between 0.02 and 1 are shown,with contour level 1 corresponding to the maximum of the largest correlationpeak. A polynomial baseline correction, apodization with a Gaussian window,and zero filling to 512 data points were used in both cases.
21 MHz results in a drastic increase in modulation depth when
Three-pulse ESEEM time traces of vanadyl pyrophosphate doped
the length of the pulses is optimized. The time-domain trace
into a powder of zinc pyrophosphate hexadecahydrate, recorded at Q-band fre-
recorded with the sequence π/2–τ –match–t–match–τ –echo,
quencies. (a) Conventional experiment with π/2 pulses of length tπ/2 = 12 ns.
(b) ESEEM with a matched second and third mw pulse of length 60 ns. In both
π/2 = 12 ns and tmatch = 60 ns, is shown in Fig. 5b. In the
cases an mw field strength of 21 MHz was used. The envelopes are normalized
corresponding spectrum a peak at the phosphorus Zeeman fre-
quency and a doublet at 12 and 31 MHz are observed. The line
intensities show a periodic behavior as a function of the lengthof the matched pulses. The low-frequency line dominates thespectrum and is maximum for tmatch = 60 ns, whereas the high-frequency line is very weak for tmatch < 45 ns and again closeto maximum for tmatch = 60 ns.
The corresponding matched HYSCORE spectrum shown in
Fig. 6b was performed with the sequence π/2–τ –match–t1–
π–t2–match–τ–echo, with tπ/2 = 12 ns, τ = 148 ns, tmatch =60 ns, and tπ = 24 ns. The correlation ridges appear now inthe (+, +) quadrant and are orthogonal to the main diagonal. The narrow peak on the diagonal at the phosphorus Zeemanfrequency is caused by distant phosphorus nuclei.
In the X-band and the matched Q-band HYSCORE spectra
shown in Fig. 6, the same data processing and the same con-tour levels (0.02–1) have been used. In both cases the peak am-plitudes are normalized on their respective maxima. Figure 6demonstrates that the signal-to-noise ratio in the matched Q-band HYSCORE spectrum is as good as the one in the standardHYSCORE at X-band. A hyperfine coupling of 18.0 MHz hasbeen determined from the maxima of the correlation ridges inthe Q-band spectrum. The slight difference in the X-band data
Integrated Q-band cw EPR spectrum of the phenalenyl radical in
may be caused by blind spots in the correlation ridges, which can
solution at room temperature, recorded with an mw power of 0.5 mW, a modu-
be avoided by recording several spectra with different settings
lation amplitude of 0.01 mT (100 kHz), a time constant of 0.25 s, and a sweeptime of 10 min. The inset shows the structure of the phenalenyl radical. The six
equivalent protons 1, 3, 4, 6, 7, and 9 have a hyperfine coupling of 17.61 MHzand the three equivalent protons 2,5, and 8 have a coupling of 5.05 MHz (35).
The experimental examples given above illustrate some of
incident power of 100 W decreases by 3 dB when the resonance
the physical aspects of pulse EPR at Q-band. The next example
frequency ν0 is shifted by about 90 MHz from the mw carrier
demonstrates that the high mw power, the short mw pulse length,
frequency νmw. This corresponds to an effective bandwidth of
and the broad resonator bandwidth at this frequency band result
the spectrometer in the FT-EPR mode of about 180 MHz. For the
in an excellent spectrometer performance for Fourier transform
generation of mw pulses with a length of 2 ns, the mw switch (7)
EPR experiments. The EPR spectrum of the phenalenyl radical
in Fig. 1 has been replaced by a faster switch with a subnanosec-
spans a spectral width of about 4.3 mT (121 MHz). The hyperfine
ond switching time. The shape of the mw pulse after the TWT
structure is due to two sets of equivalent protons (see inset in
amplifier is shown in the inset in Fig. 8. Pulse rise and fall times
Fig. 7), three protons with a coupling of 5.05 MHz, and six
of 0.6 ns were measured using an amplitude mw detector and
protons with a coupling of 17.61 MHz (35). The integrated cw
an oscilloscope with 1-GHz bandwidth. The ringing observed
room temperature spectrum measured at 35.31 GHz in 10 min
after the pulse is caused by the video circuit.
is shown in Fig. 7. An mw power of 0.5 mW and a modulation
Magnitude FT-EPR spectra of the phenalenyl radical mea-
amplitude of 0.01 mT were used. The spectrum consists of seven
sured at ν0 − νmw ≈ 0 and ν0 − νmw ≈ 101 MHz, where ν0 is the
quartets with intensities close to theoretical prediction 1 : 6 :
resonance frequency at the center of the spectrum, are shown in
15 : 20 : 15 : 6 : 1. The linewidth of about 0.07 mT is due to the
Figs. 8a and 8b. The frequency of the cavity was kept constant
high radical concentration and the inhomogeneity of the static
during these measurements. The mw frequency was 20 MHz
magnetic field of about 0.03 mT/cm perpendicular to this field.
lower in (b) than in (a), to allow for a partial compensation of
Because of the field inhomogeneity, only a small sample volume
the lost in excitation/detection efficiency, when the center of the
(7 mm in a quartz tube with 1.6-mm outer diameter) was used.
cavity response curve does not coincide with the center of the
A rectangular cavity (dimensions 7×3.5×8.6 mm) operating
EPR line. In both cases quadrature detection was used. The FID
in the TE102 mode is used for FT-EPR experiments in solution.
can be observed for approximately 1.5 µs. The decays were
The cavity is connected to the waveguide through a fixed iris
recorded with a LeCroy oscilloscope with 2.5 GS/s sampling
(2.8 × 1.5 mm). With this iris dimensions and a Teflon insert
rate, and an average over 1000 traces was taken during 30 s.
which supports the 1.6-mm sample tube in the cavity, a quality
Data acquisition was started 100 ns after the mw pulse to avoid
factor of about 150 is obtained at 35.3 GHz. With a DPPH test
the accumulation of noise from the TWT. The FT-EPR spectra
sample, we found that the amplitude of the free induction decay
nicely reproduce the cw EPR spectrum of the phenalenyl radi-
signal generated by an mw pulse with a length of 2 ns and an
cal, except for the lines of the outer quartets which are 60 times
Magnitude FT-EPR spectra of the phenalenyl radical at 35.3 GHz. (a) The carrier mw frequency coincides with the electron Zeeman frequency at the
center of the spectrum. (b) Microwave and Zeeman frequencies differ by about 100 MHz. The spectra were recorded with an mw pulse of length 2 ns (shown ininset) and an incident power of 100 W. Quadrature detection was used. The average of 1000 FID signals digitized at 2.5 GS/s was taken. The repetition rate was1 kHz and the measuring time was about 30 s. Apodization with a Gaussian window and zero filling were performed prior to Fourier transformation.
weaker than the strongest line in the spectrum. The FT-EPR
show, in addition to well-known features, performances which
spectra are slightly asymmetric because of a peculiarity in the
are specific for this frequency band. It is demonstrated that
shape of the cavity characteristic curve. Nevertheless, Fig. 8
the classical rectangular Q-band resonator, operating in TE102
demonstrates that it is possible to measure FT-EPR spectra at
mode, provides a wide excitation bandwidth in FT-EPR experi-
Q-band within a frequency band of about 120 MHz by using an
ments, that hyperfine enhancement allows one to perform pulse
overcoupled TE102 cavity and short pulses with 100-W incident
ENDOR of nuclei with low gyromagnetic ratios using relatively
short RF pulses, and that even the loss in the modulation depthof ESEEM experiments can be compensated so that HYSCORE
CONCLUSION
techniques can be used at Q-band widely. The examples illustratethat virtually all one- and two-dimensional pulse EPR experi-
A high-power pulse EPR spectrometer operating at Q-band
ments that require extended phase cycling procedures, two mw
frequencies is described. The performance of the spectrometer
frequencies, or matching and decoupling pulses can be imple-
is demonstrated by pulse ENDOR, conventional and matched
mented at Q-band making use of all of the benefits of EPR at
HYSCORE, and FT-EPR experiments. The chosen experiments
high frequencies. Recently, multiphoton echoes where an even
or an odd number of RF and mw photons is involved have also
15. C. E. Davoust, P. E. Doan, and B. M. Hoffman, Q-band pulsed electron spin-
been studied with this spectrometer (36).
echo spectrometer and its application to ENDOR and ESEEM, J. Magn. Reson. A 119, 38–44 (1996). 16. B. E. Sturgeon and R. D. Britt, Sensitive pulsed EPR spectrometer with an
ACKNOWLEDGMENT
8–18 GHz frequency range, Rev. Sci. Instrum. 63, 2187–2192 (1992). 17. P. P. Borbat, R. H. Crepeau, and J. H. Freed, Multifrequency two-
This research was supported by the Swiss National Science Foundation. We
dimensional Fourier transform ESR: An X/Ku-band spectrometer, J. Magn.
thank J. S. Hyde for the donation of a Q-band klystron. The assistance of
Reson. 127, 155–167 (1997).
K. Chernov and S. Orlinskii is gratefully acknowledged. We thank Hewlett
18. A. Abragam and B. Bleaney, “Electron Paramagnetic Resonance of Transi-
Packard (Switzerland) for loaning out a network analyzer. We are grateful to
tion Ions,” Clarendon Press, Oxford, 1970.
Willi Groth for the mechanical construction of the bridge, the resonators, andthe probe heads, to Lorenz Liesum for providing the X-band HYSCORE spec-
19. A. Lai, H. L. Flanagan, and D. J. Singel, Multifrequency electron spin echo
trum of vanadyl pyrophosphate, and to Walter L¨ammler for sample preparation.
envelope modulation in S = 1/2, I = 1/2 systems: Analysis of the spectral amplitudes, line shapes, and linewidths, J. Chem. Phys. 89, 7161–7166 (1988). REFERENCES 20. I. A. Gromov, S. B. Orlinskii, and R. M. Rakhmatoullin, Rare earth ions envi-
ronment in sodium borosilicate glasses studied with ESEEM spectroscopy,
1. A. Schweiger, Pulsed electron spin resonance spectroscopy: Basic princi-
Proc. XXVIII Congress AMPERE, Canterbury 451–452 (1996).
ples, techniques, and examples of applications, Angew. Chem. Int. Ed. Engl.21. P. H¨ofer, A. Grupp, H. Nebenf¨uhr, and M. Mehring, Hyperfine sublevel cor-
30, 265–292 (1991).
relation (HYSCORE) spectroscopy: A 2D ESR investigation of the squaric
2. S. A. Dikanov and Yu. D. Tsvetkov, “Electron Spin Echo Enve-
acid radical, Chem. Phys. Lett. 132, 279–282 (1986).
lope Modulation (ESEEM) Spectroscopy,” CRC Press, Boca Raton, FL,
22. D. Goldfarb, V. Kofman, J. Libman, A. Shanzer, R. Rakhmatouline, S. Van
Doorslaer, and A. Schweiger, Double nuclear coherence transfer (DONUT)-
3. W. B. Mims, Electron spin echoes, in “Electron Paramagnetic Resonance”
HYSCORE: A new tool for the assignment of nuclear frequencies in pulsed
(S. Geschwind, Ed.), pp. 263–351, Plenum, New York, 1972.
EPR experiments, J. Am. Chem. Soc. 120, 7020–7029 (1998). 4. L. Kevan and R. N. Schwartz (Eds.), “Time Domain Electron Spin Reso-
23. G. Jeschke and A. Schweiger, Hyperfine-correlated electron nuclear double
resonance spectroscopy, Chem. Phys. Lett. 246, 431–438 (1995). 5. L. Kevan and M. K. Bowman (Eds.), “Modern Pulsed and Continuous Wave
24. G. Jeschke and A. Schweiger, Generation and transfer of coherence in
Electron Spin Resonance,” Wiley, New York, 1990.
electron-nuclear spin systems by non-ideal microwave pulses, Mol. Phys.6. T. F. Prisner, Pulsed high-frequency/high-field EPR, Adv. Magn. Opt. Reson.88, 355–383 (1996). 20, 245–298 (1997). 25. G. Jeschke and A. Schweiger, Matched two-pulse electron spin echo enve-
7. I. Gromov, V. Krymov, P. Manikandan, D. Arieli, and D. Goldfarb, A W-
lope modulation spectroscopy, J. Chem. Phys. 105, 2199–2211 (1996).
band pulsed ENDOR spectrometer: Setup and application to transition metal
26. G. Jeschke, R. Rakhmatoullin, and A. Schweiger, Sensitivity enhancement
centers, J. Magn. Reson. 139, 8–17 (1999).
by matched microwave pulses in one- and two-dimensional electron spin
8. P. Manikandan, R. Carmieli, T. Shane, A. J. Kalb (Gilboa), and D. Goldfarb,
echo envelope modulation spectroscopy, J. Magn. Reson. 131, 261–271
W-band ENDOR investigation of the manganese-binding site of con-
canavalin A: Determination of proton hyperfine couplings and their signs,
27. Th. Wacker, Ph. D. Thesis, ETH, Zurich, No. 9913 (1992). J. Am. Chem. Soc. 122, 3488–3494 (2000). 28. J. J. Shane, I. Gromov, S. Vega, and D. Goldfarb, A versatile pulsed X-band
9. M. Bennati, C. T. Farrar, J. A. Bryant, S. J. Inati, V. Weis, G. J. Gerfen,
ENDOR spectrometer, Rev. Sci. Instrum. 98, 3357–3364 (1998).
P. Riggs-Gelasco, J. Stubbe, and R. G. Griffin, Pulsed electron-nuclear
29. S. Stoll, G. Jeschke, M. Willer, and A. Schweiger, Nutation-Frequency cor-
double resonance (ENDOR) at 140 GHz, J. Magn. Reson. 138, 232–243
related EPR spectroscopy: The PEANUT experiment, J. Magn. Reson. 130, 10. M. T. Bennebroek and J. Schmidt, Pulsed ENDOR spectroscopy at large
30. M. Fujimoto, C. A. McDowell, and T. Takui, Ligand ENDOR spectra of
thermal spin polarizations and the absolute sign of the hyperfine interaction,
Cu(II) impurity complexes in α-glycine crystals, J. Chem. Phys. 70, 3694– J. Magn. Reson. 128, 199–206 (1997). 11. M. Willer, J. Forrer, J. Keller, S. Van Doorslaer, A. Schweiger, R. 31. I. Solomon, Rotary spin echoes, Phys. Rev. Lett. 2, 301–302 (1959).
Schuhmann, and T. Weiland, S-band (2–4 GHz) pulse electron paramagneticresonance spectrometer: Construction, probe head design, and performance,
32. R. R. Ernst, G. Bodenhausen, and A. Wokaun, “Principles of Nuclear Mag-
Rev. Sci. Instrum. 71, 2807–2817 (2000).
netic Resonance in One and Two Dimensions,” Clarendon Press, Oxford,1987. 12. G. A. Rinard, R. W. Quine, R. Song, G. R. Eaton, and S. S. Eaton, Ab-
solute EPR spin echo and noise intensities, J. Magn. Reson. 140, 69–83 33. C. Gemperle, G. Aebli, A. Schweiger, and R. R. Ernst, Phase cycling in
pulse EPR, J. Magn. Reson. 88, 241–256 (1990). 13. R. de Beer, R. P. J. Merks, Observation of electron spin echoes at 35 GHz
34. J.-M. Fauth, A. Schweiger, and R. R. Ernst, Recovery of broad hyperfine
with a modified Ka-band EPR/ENDOR spectrometer, Delft. Progr. Rep. 4,
lines in electron spin-echo envelope modulation spectroscopy of disordered
systems, J. Magn. Reson. 81, 262–274 (1989). 14. I. A. Gromov, S. B. Orlinskii, and R. M. Rakhmatoullin, Applica-
35. F. Gerson, Notiz ¨uber das ESR.-Spektrum des Phenalenyl-Radikals, Helv.
tion of Q-band electron spin echo spectrometer to investigation of
Chim. Acta 49, 1463–1467 (1966).
glasses doped with rare earth ions, Appl. Magn. Reson. 3, 1147–1158 36. I. Gromov and A. Schweiger, Multiphoton resonances in pulse EPR, J.Magn. Reson. 146, 110–121 (2000).
VADEN HEALTH CENTER STANFORD UNIVERSITY The colposcope is an instrument with a bright light and a magnifying lens that is useful in evaluating areas of the anogenital tract of men of women for signs of infection with the Human Papillomavirus (HPV). Most commonly the colposcope is used to closely evaluate a women’s cervix when she has an abnormal pap smear. The colposcopy examinati
Groep 3, 4, 5 heeft een eigen verhalenboek gemaakt. Hier leest u de verhaaltjes die in het boek Sprookje Er is een schat. De schat ligt onder het zand. De Ik lees een boek van sprookjes van de reus en Klein schat is een kroon. Wat doe je er mee? Je bewaart Duimpje. En Klein Duimpje pakt de laars van de reus. En Klein Duimpje rent er mee weg naar zijn huis en trekt de

 Journal of Magnetic Resonance 149, 196–203 (2001)
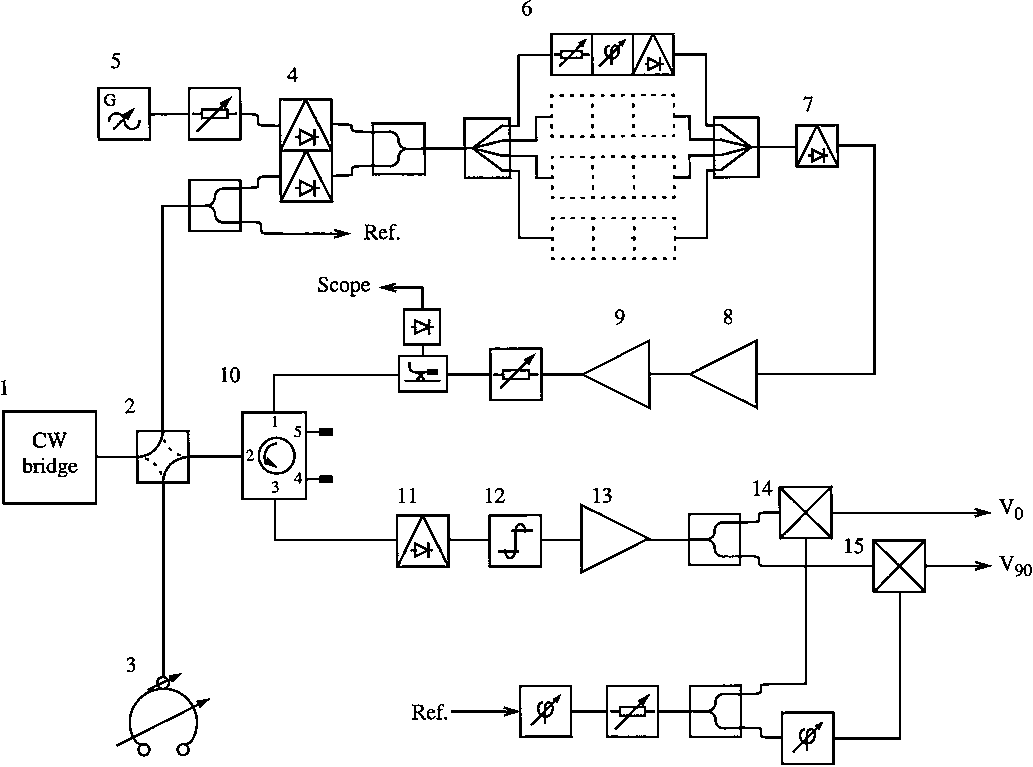 It has been demonstrated that pulse ENDOR and ESEEM ex-
periments at Q-band frequencies can be carried out by using aslightly modified low-power superheterodyne EPR spectrometer(13). With this setup a number of standard pulse EPR experi-ments have been carried out on some particular samples. Betterperformance was obtained with an incoherent instrument usinga pulsed IMPATT generator as the mw source (14, 20). Re-cently, a coherent high-power spectrometer has been describedwhich uses homodyne detection and a TWT amplifier for themw pulses (15). These authors also discussed sensitivity as-pects of ESEEM and pulse ENDOR experiments at Q-bandand presented a number of applications using standard pulseschemes.
It has been demonstrated that pulse ENDOR and ESEEM ex-
periments at Q-band frequencies can be carried out by using aslightly modified low-power superheterodyne EPR spectrometer(13). With this setup a number of standard pulse EPR experi-ments have been carried out on some particular samples. Betterperformance was obtained with an incoherent instrument usinga pulsed IMPATT generator as the mw source (14, 20). Re-cently, a coherent high-power spectrometer has been describedwhich uses homodyne detection and a TWT amplifier for themw pulses (15). These authors also discussed sensitivity as-pects of ESEEM and pulse ENDOR experiments at Q-bandand presented a number of applications using standard pulseschemes.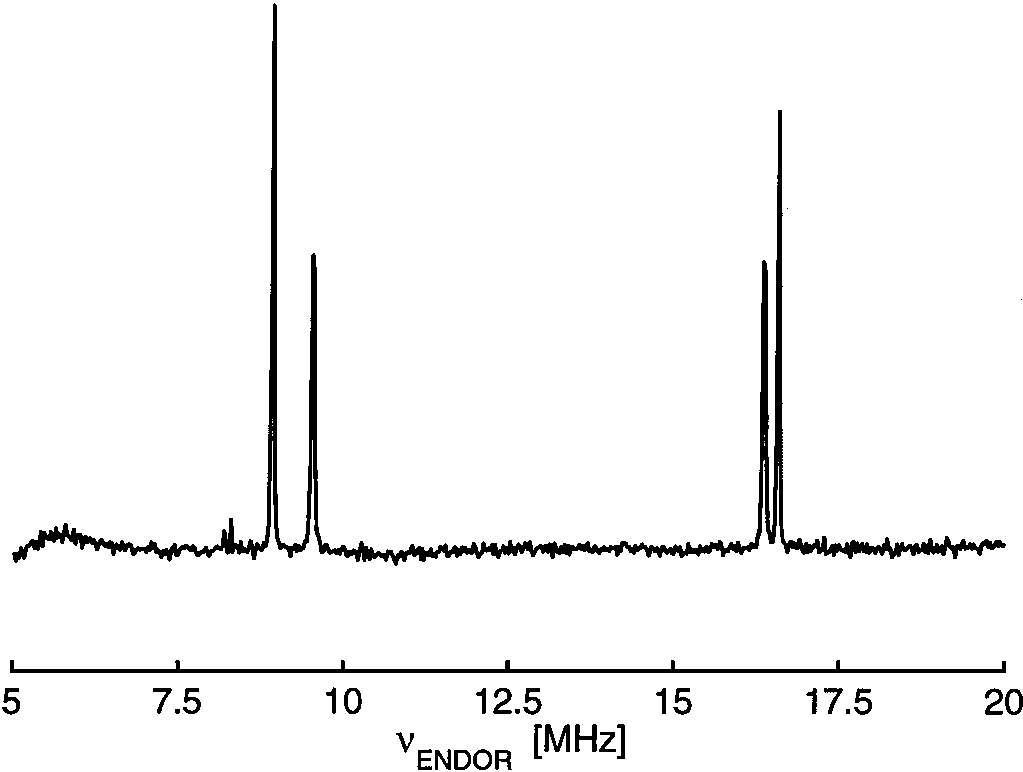 EPR experiments where ultrashort mw pulses are required, the
The spectrometer acquisition system is similar to the one re-
switch (7) is replaced by a fast switch with a rise and fall time
ported earlier (28). It consists of a digital word generator (In-
terface Technology, RS690, 250 MHz), a gated integrator (SRS,
After passing the rotary attenuator (HP, R382A, 0–50 dB), the
SR250), a data acquisition board (Keithley, DAS1202), a GPIB
high-power pulses are fed to the input of the five-port circulator
interface, and a user-friendly acquisition program which runs on
(10). A part of the mw power is directed to a diode detector to
a personal computer. The instrument library of the program is
examine the pulses. The isolation of the circulator is improved
extended by the arbitrary waveform generator (LeCroy, LW420),
by introducing a small dielectric disc into port 2 which acts as
and the experiment library is expanded for experiments such as
a tuning inhomogeneity. By an appropriate positioning of the
matched ESEEM, HYSCORE (26), PEANUT (29), and a num-
disc, more than 42-dB attenuation of the wave propagating from
ber of other state-of-the-art sequences. The transient signals are
port 1 to port 3 has been obtained within a 2-GHz range. This is
recorded with a digital oscilloscope (LeCroy, LC534, 1-GHz
at least 12 dB better than that obtained with a broadband factory
All routine Q-band pulse EPR and ENDOR measurements
PERFORMANCE AND EXAMPLES
EPR experiments where ultrashort mw pulses are required, the
The spectrometer acquisition system is similar to the one re-
switch (7) is replaced by a fast switch with a rise and fall time
ported earlier (28). It consists of a digital word generator (In-
terface Technology, RS690, 250 MHz), a gated integrator (SRS,
After passing the rotary attenuator (HP, R382A, 0–50 dB), the
SR250), a data acquisition board (Keithley, DAS1202), a GPIB
high-power pulses are fed to the input of the five-port circulator
interface, and a user-friendly acquisition program which runs on
(10). A part of the mw power is directed to a diode detector to
a personal computer. The instrument library of the program is
examine the pulses. The isolation of the circulator is improved
extended by the arbitrary waveform generator (LeCroy, LW420),
by introducing a small dielectric disc into port 2 which acts as
and the experiment library is expanded for experiments such as
a tuning inhomogeneity. By an appropriate positioning of the
matched ESEEM, HYSCORE (26), PEANUT (29), and a num-
disc, more than 42-dB attenuation of the wave propagating from
ber of other state-of-the-art sequences. The transient signals are
port 1 to port 3 has been obtained within a 2-GHz range. This is
recorded with a digital oscilloscope (LeCroy, LC534, 1-GHz
at least 12 dB better than that obtained with a broadband factory
All routine Q-band pulse EPR and ENDOR measurements
PERFORMANCE AND EXAMPLES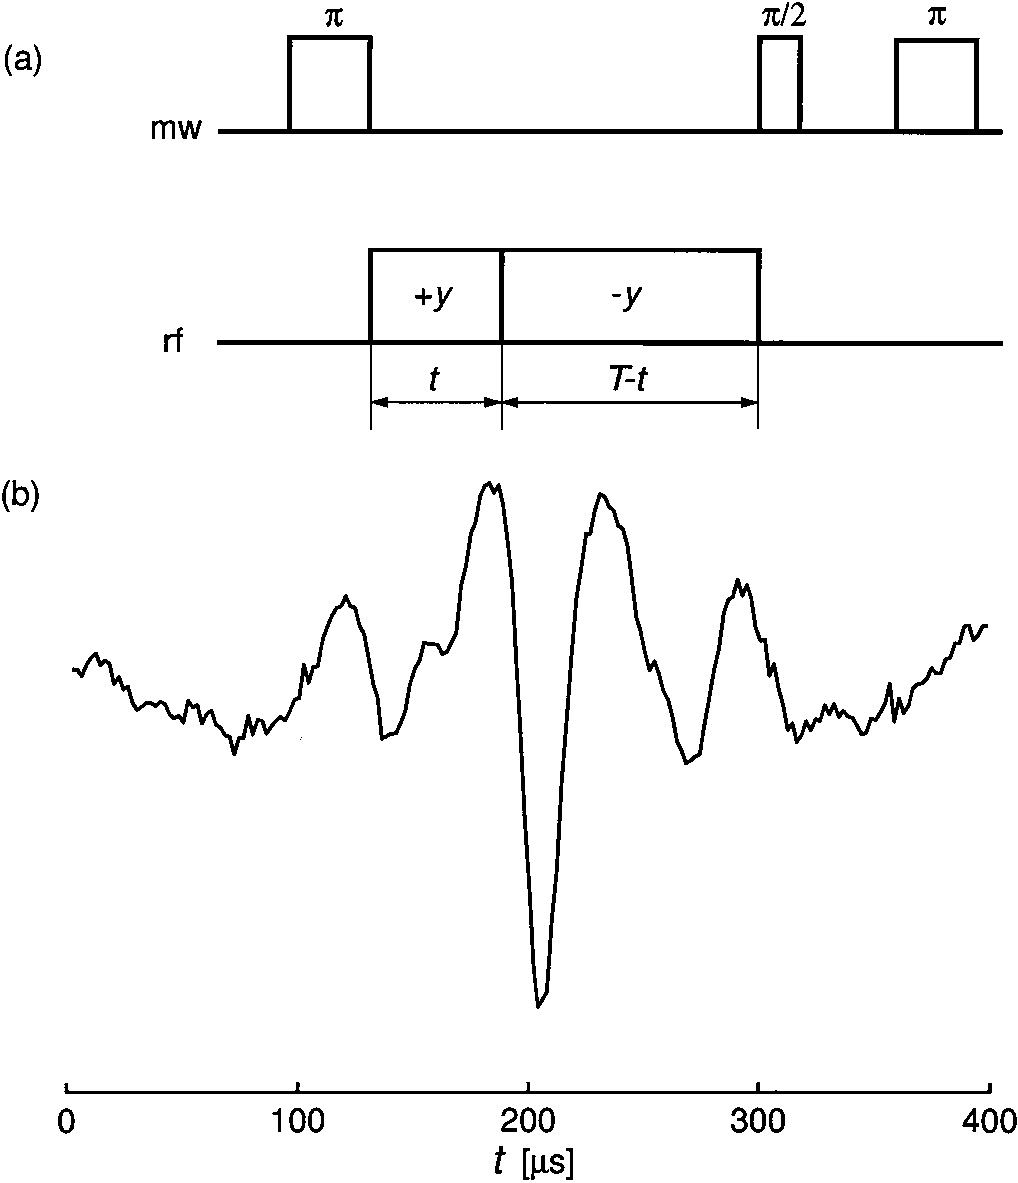
 for an RF power of 100 W the effective nitrogen nutation fre-quency is νnut = 7.7 kHz (Fig. 3b). Using the conversion factor
proton resonance frequency (54.4 MHz) are the same, a B2 fieldof 0.6 mT is found at 16.56 MHz, resulting in an enhancementfactor + = νnuth ≈ 4.1, where g
the nitrogen nucleus. This enhancement factor is close to the
= 1 + Ah ≈ 4.3, where A = (ν2α−ν2β)h
is the hyperfine coupling and να, νβ are the observed ENDORfrequencies. For the low-frequency line of the ENDOR spectrumthe factor is found to be − = 2.4, which is close to the value
= |1 − Ah | ≈ 2.3. The result indicates
that for strongly coupled nuclei with a low magnetic momentlike 14N the ENDOR enhancement factor at Q-band is consid-erable, which still allows us to perform ENDOR experimentswith relatively short RF pulses. For comparison, at 95 GHz the
+ factor for the case at hand is about 2, and at 9.5 GHz it is
The third example demonstrates that two-dimensional (2D)
experiments can easily be implemented on the spectrom-eter. The HYSCORE experiment with the pulse sequence
Transient nutations of nitrogen nuclei resonating at 16.56 MHz
π/2–τ–π/2–t1–π–t2–π/2–τ–echo, was again performed on the
(high-frequency line in Fig. 2). (a) Pulse sequence with two RF pulses of opposite
copper-doped α-glycine single crystal with pulse length tπ/2 =
phase. (b) Oscillations of the electron spin echo as a function of time t .
for an RF power of 100 W the effective nitrogen nutation fre-quency is νnut = 7.7 kHz (Fig. 3b). Using the conversion factor
proton resonance frequency (54.4 MHz) are the same, a B2 fieldof 0.6 mT is found at 16.56 MHz, resulting in an enhancementfactor + = νnuth ≈ 4.1, where g
the nitrogen nucleus. This enhancement factor is close to the
= 1 + Ah ≈ 4.3, where A = (ν2α−ν2β)h
is the hyperfine coupling and να, νβ are the observed ENDORfrequencies. For the low-frequency line of the ENDOR spectrumthe factor is found to be − = 2.4, which is close to the value
= |1 − Ah | ≈ 2.3. The result indicates
that for strongly coupled nuclei with a low magnetic momentlike 14N the ENDOR enhancement factor at Q-band is consid-erable, which still allows us to perform ENDOR experimentswith relatively short RF pulses. For comparison, at 95 GHz the
+ factor for the case at hand is about 2, and at 9.5 GHz it is
The third example demonstrates that two-dimensional (2D)
experiments can easily be implemented on the spectrom-eter. The HYSCORE experiment with the pulse sequence
Transient nutations of nitrogen nuclei resonating at 16.56 MHz
π/2–τ–π/2–t1–π–t2–π/2–τ–echo, was again performed on the
(high-frequency line in Fig. 2). (a) Pulse sequence with two RF pulses of opposite
copper-doped α-glycine single crystal with pulse length tπ/2 =
phase. (b) Oscillations of the electron spin echo as a function of time t .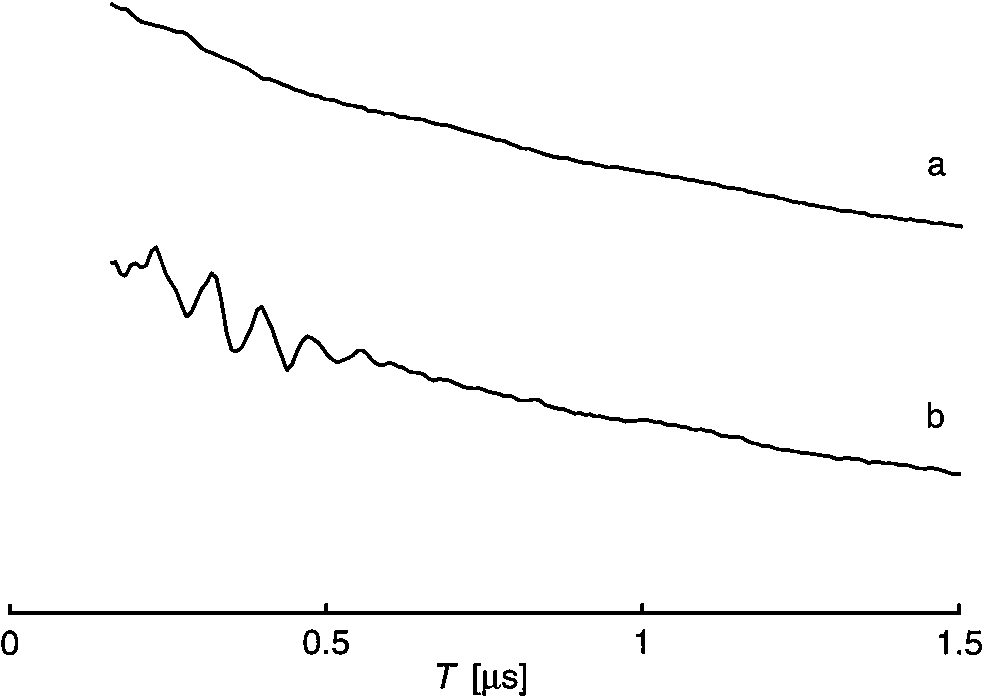
 and (−9.28, 16.44) MHz are observed in the (−, +) quadrant,which are at least one order of magnitude more intense then theresidual peaks on the main diagonal. The splittings observed inthe ENDOR spectrum (Fig. 2) are not resolved in the HYSCOREexperiment since we used a relatively poor resolution in the lat-ter experiment because of measuring time limitation (3 h per160 by 160 points).
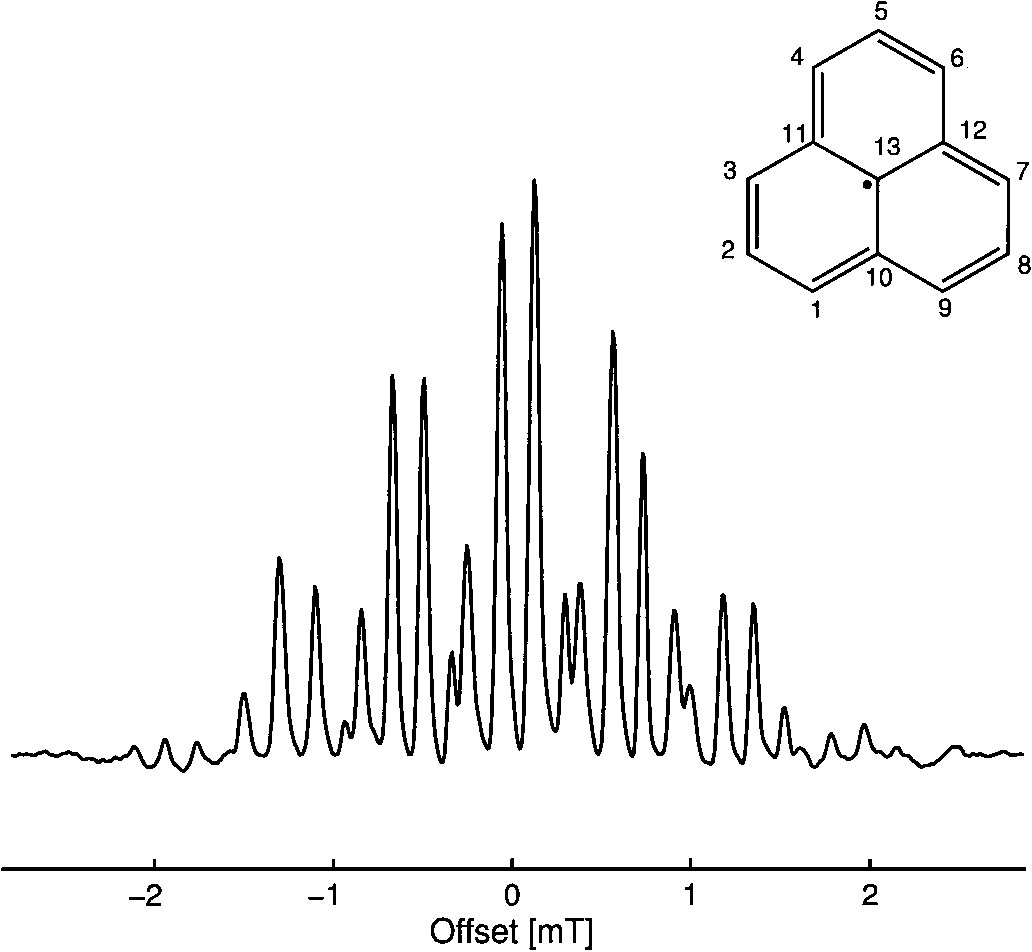 intensities show a periodic behavior as a function of the lengthof the matched pulses. The low-frequency line dominates thespectrum and is maximum for tmatch = 60 ns, whereas the high-frequency line is very weak for tmatch < 45 ns and again closeto maximum for tmatch = 60 ns.
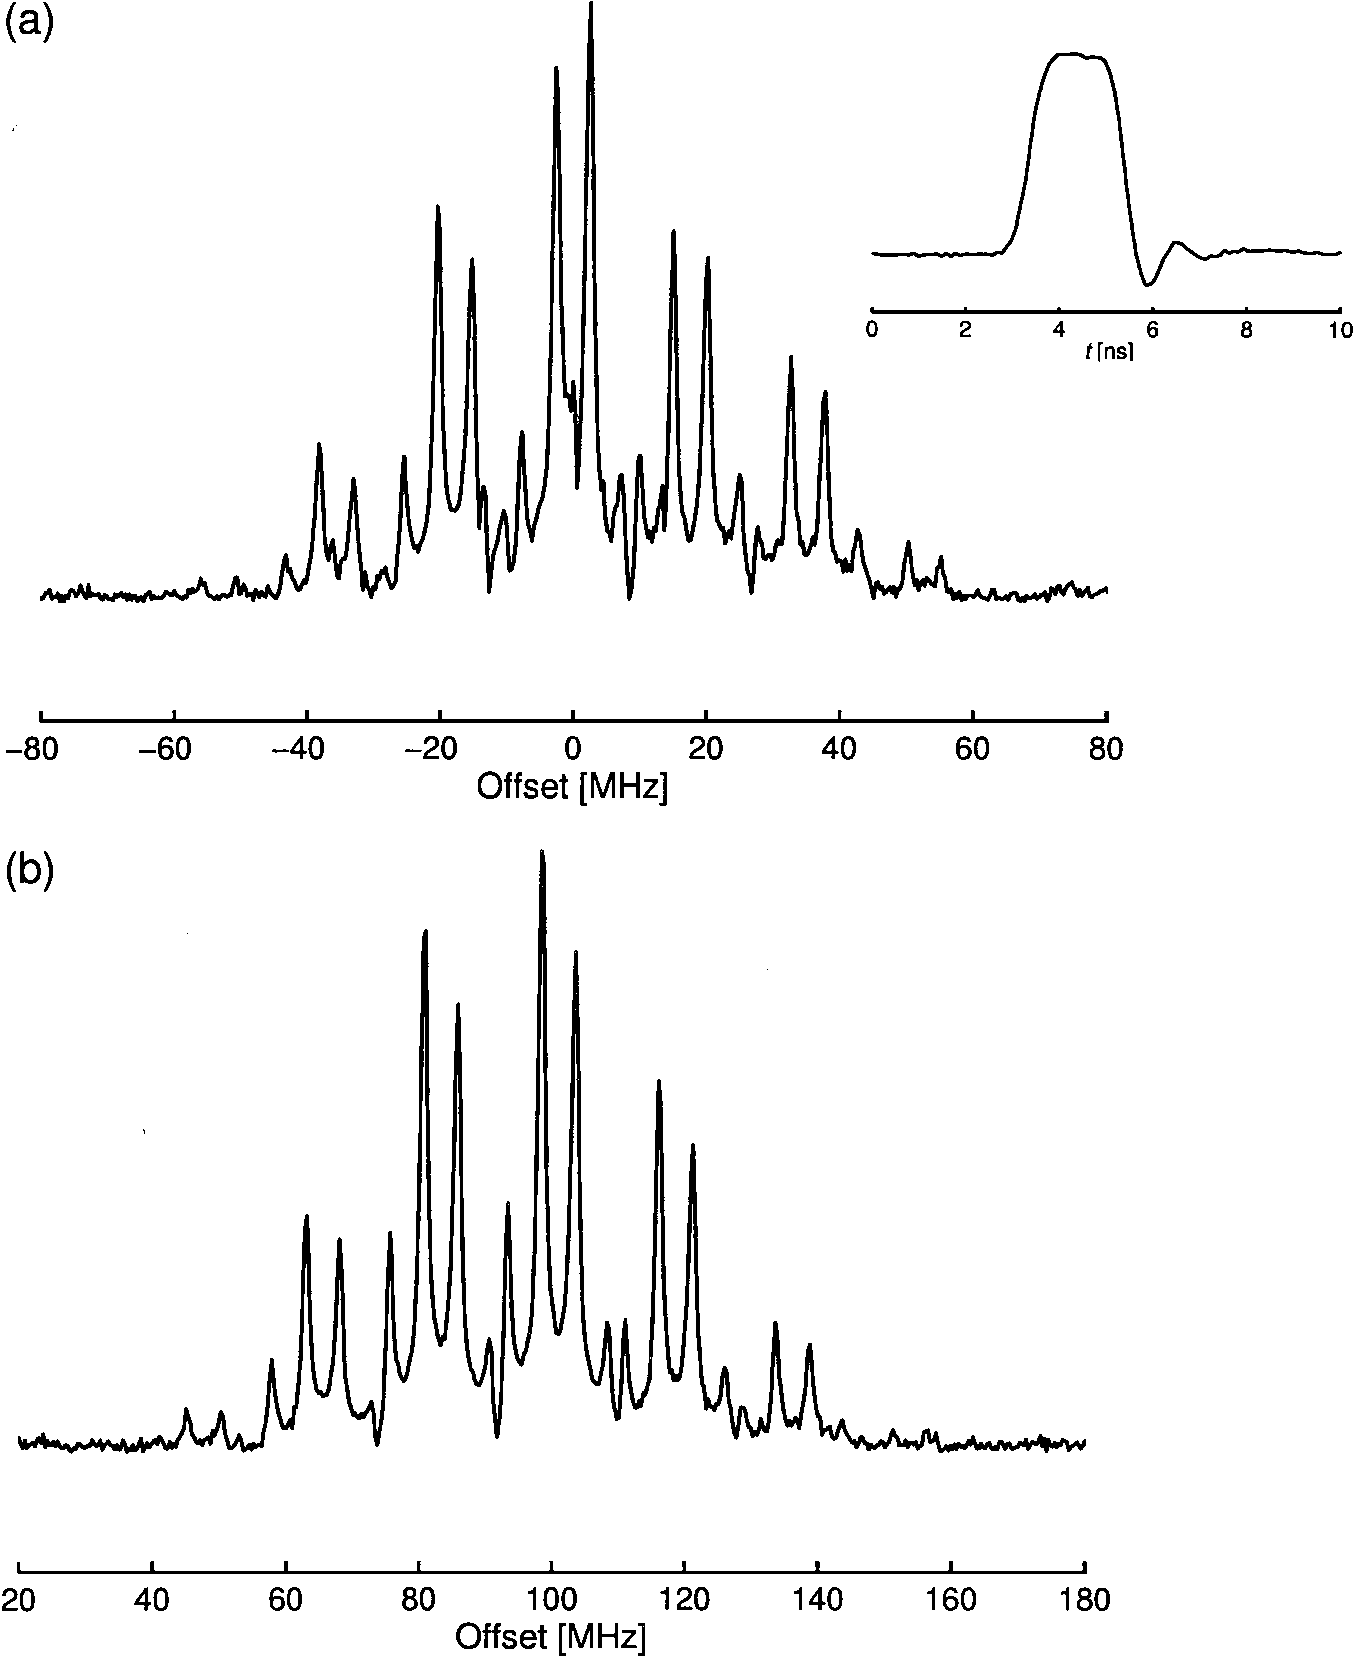 Magnitude FT-EPR spectra of the phenalenyl radical at 35.3 GHz. (a) The carrier mw frequency coincides with the electron Zeeman frequency at the
center of the spectrum. (b) Microwave and Zeeman frequencies differ by about 100 MHz. The spectra were recorded with an mw pulse of length 2 ns (shown ininset) and an incident power of 100 W. Quadrature detection was used. The average of 1000 FID signals digitized at 2.5 GS/s was taken. The repetition rate was1 kHz and the measuring time was about 30 s. Apodization with a Gaussian window and zero filling were performed prior to Fourier transformation.
Magnitude FT-EPR spectra of the phenalenyl radical at 35.3 GHz. (a) The carrier mw frequency coincides with the electron Zeeman frequency at the
center of the spectrum. (b) Microwave and Zeeman frequencies differ by about 100 MHz. The spectra were recorded with an mw pulse of length 2 ns (shown ininset) and an incident power of 100 W. Quadrature detection was used. The average of 1000 FID signals digitized at 2.5 GS/s was taken. The repetition rate was1 kHz and the measuring time was about 30 s. Apodization with a Gaussian window and zero filling were performed prior to Fourier transformation.